Tags : Supply Chain, Inventory Management, ABC Analysis, Pareto Principle, Demand Variability, Automation, Google Sheets
Context
Hi! I’m Samir — a Supply Chain Engineer and Data Scientist based in Paris, and founder of LogiGreen Consulting.
I help companies optimise inventory and logistics operations by combining data analytics and workflow automation.
This workflow is part of our inventory optimisation toolkit , allowing businesses to perform ABC classification and Pareto analysis directly from their transactional sales data.
Automate inventory segmentation with n8n!
📬 For business inquiries, feel free to connect with me on LinkedIn
Who is this template for?
This workflow is designed for supply chain analysts , demand planners , or inventory managers who want to:
- Identify their top-performing items (Pareto 80/20 principle)
- Classify products into ABC categories based on sales contribution
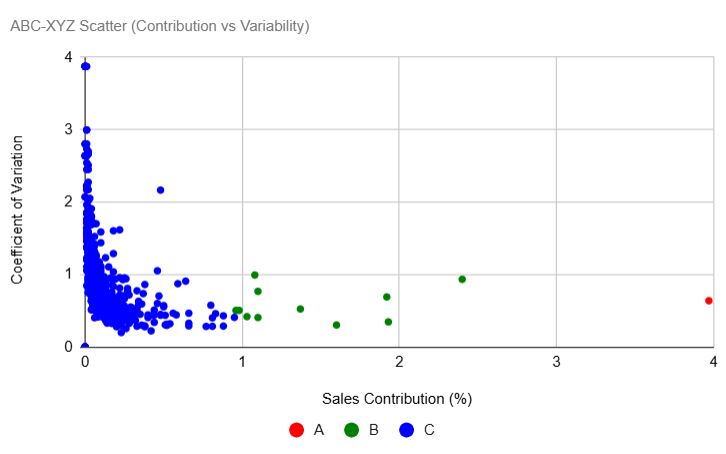
- Evaluate demand variability (XYZ classification support)
Imagine you have a Google Sheet where daily sales transactions are stored:
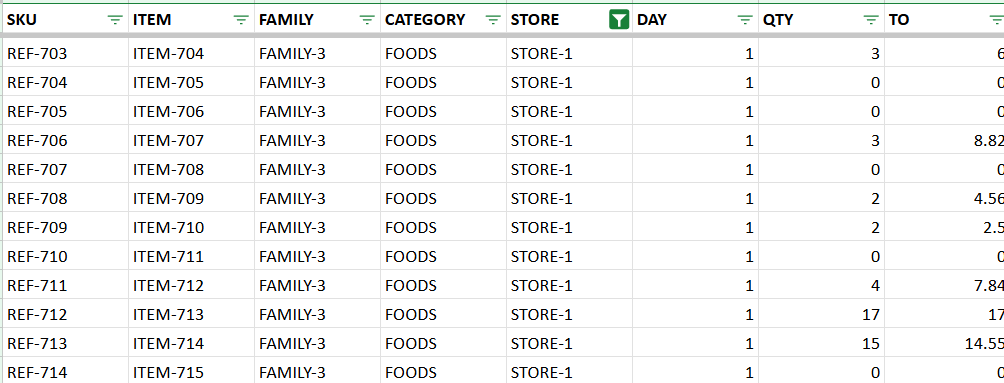
The workflow aggregates sales by item, calculates cumulative contribution, and assigns A, B, or C classes. It also computes mean, standard deviation, and coefficient of variation (CV) to highlight demand volatility.
How does it work?
This workflow automates the process of ABC & Pareto analysis from raw sales data:
- 📊 Google Sheets input provides daily transactional sales
- 🧮 Aggregation & code nodes compute sales, turnover, and cumulative shares
- 🧠 ABC class mapping assigns items into A/B/C buckets
- 📈 Demand variability metrics (XYZ) are calculated
- 📑 Results are appended into dedicated Google Sheets tabs for reporting

🎥 Watch My Tutorial
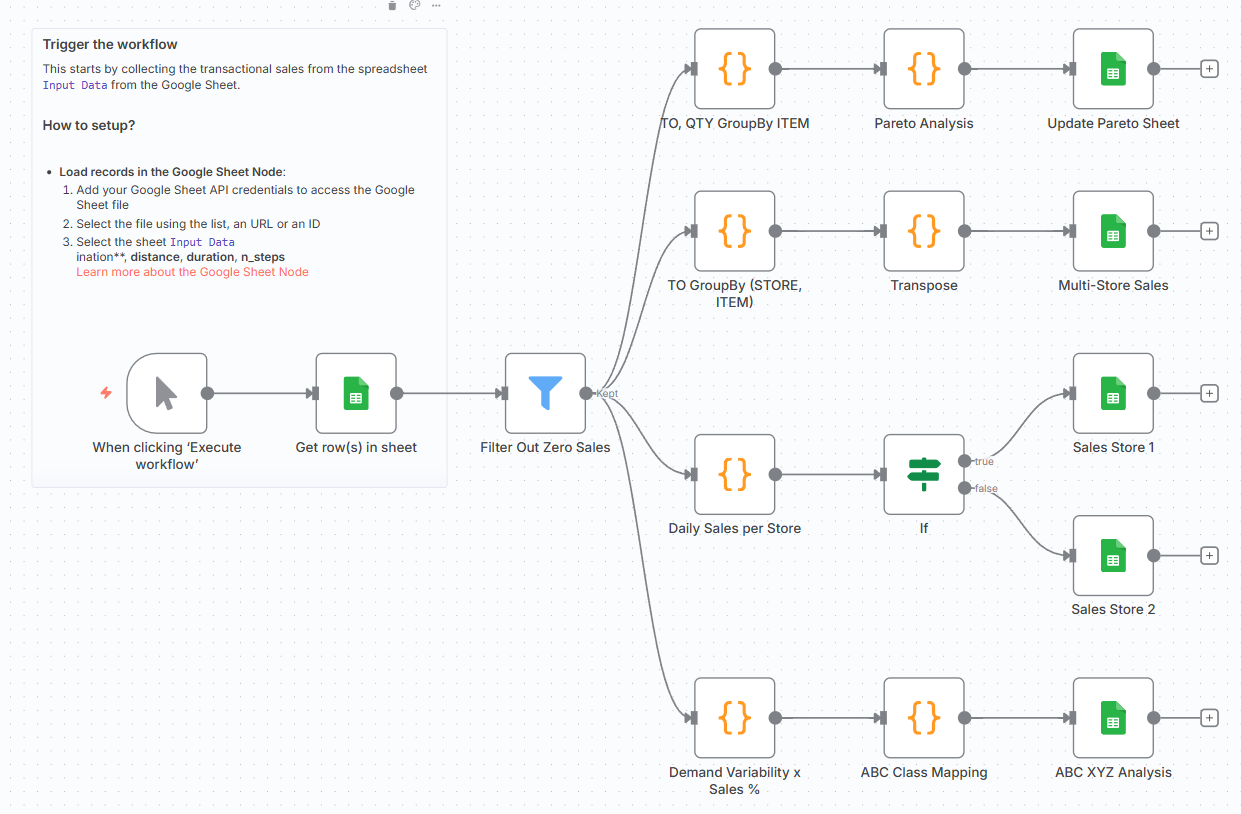
Steps:
- 📝 Load daily sales records from Google Sheets
- 🔎 Filter out items with zero sales
- 📊 Aggregate sales by store , item , and day
- 📈 Perform Pareto analysis to calculate cumulative turnover share
- 🧮 Compute demand variability (mean, stdev, CV)
- 🧠 Assign ABC classes based on cumulative share thresholds
- 📥 Append results into ABC XYZ and Pareto output sheets
What do I need to get started?
You’ll need:
- A Google Sheet with sales transactions (date, item, quantity, turnover) that is available here: Test Sheet
- A Google Sheets account connected in n8n
- Basic knowledge of inventory analysis (ABC/XYZ)
Next Steps
🗒️ Use the sticky notes in the n8n canvas to:
- Add your Google Sheets credentials
- Replace the Sheet ID with your own sales dataset
- Run the workflow and check the output tabs: ABC XYZ , Pareto , and Store Sales
This template was built using n8n v1.107.3
Submitted: September 15, 2025