✨ Summary
Efficiently monitor Kubernetes environments by sending only unique error logs from Grafana Loki to Slack. Reduces alert fatigue while keeping your team informed about critical log events.
🧑💻 Who’s it for
- DevOps or SRE engineers running EKS/GKE/AKS
- Anyone using Grafana Loki and Promtail for centralized logging
- Teams that want Slack alerts but hate alert spam
🔍 What it does
This n8n workflow queries your Loki logs every 5 minutes, filters only the critical ones (error, timeout, exception, etc.), removes duplicate alerts within the batch, and sends clean alerts to a Slack channel with full metadata (pod, namespace, node, container, log, timestamp).
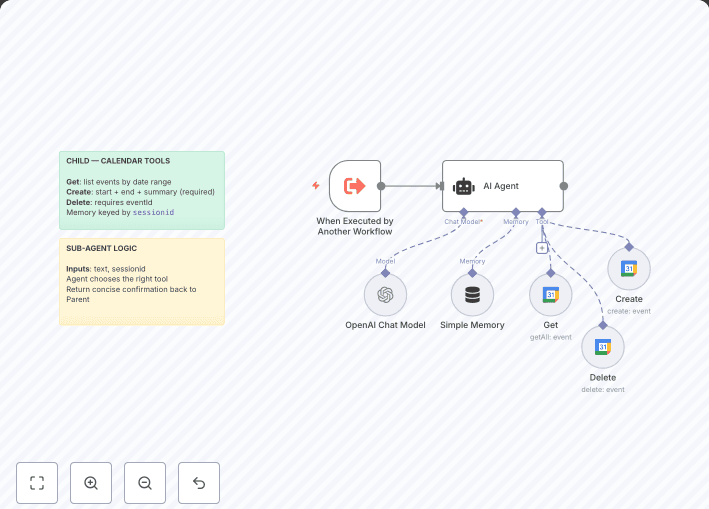
🧠 How it works
🕒 Schedule Trigger
Every 5 minutes (customizable)
🌐 Loki HTTP Query
Pulls logs from the last 10 minutes
Keyword match: error, failed, oom, etc.
🧹 Log Parsing
Extracts log fields (pod, container, etc.)
Skips empty/malformed results
🧠 Deduplication
Removes repeated error messages (within query window)
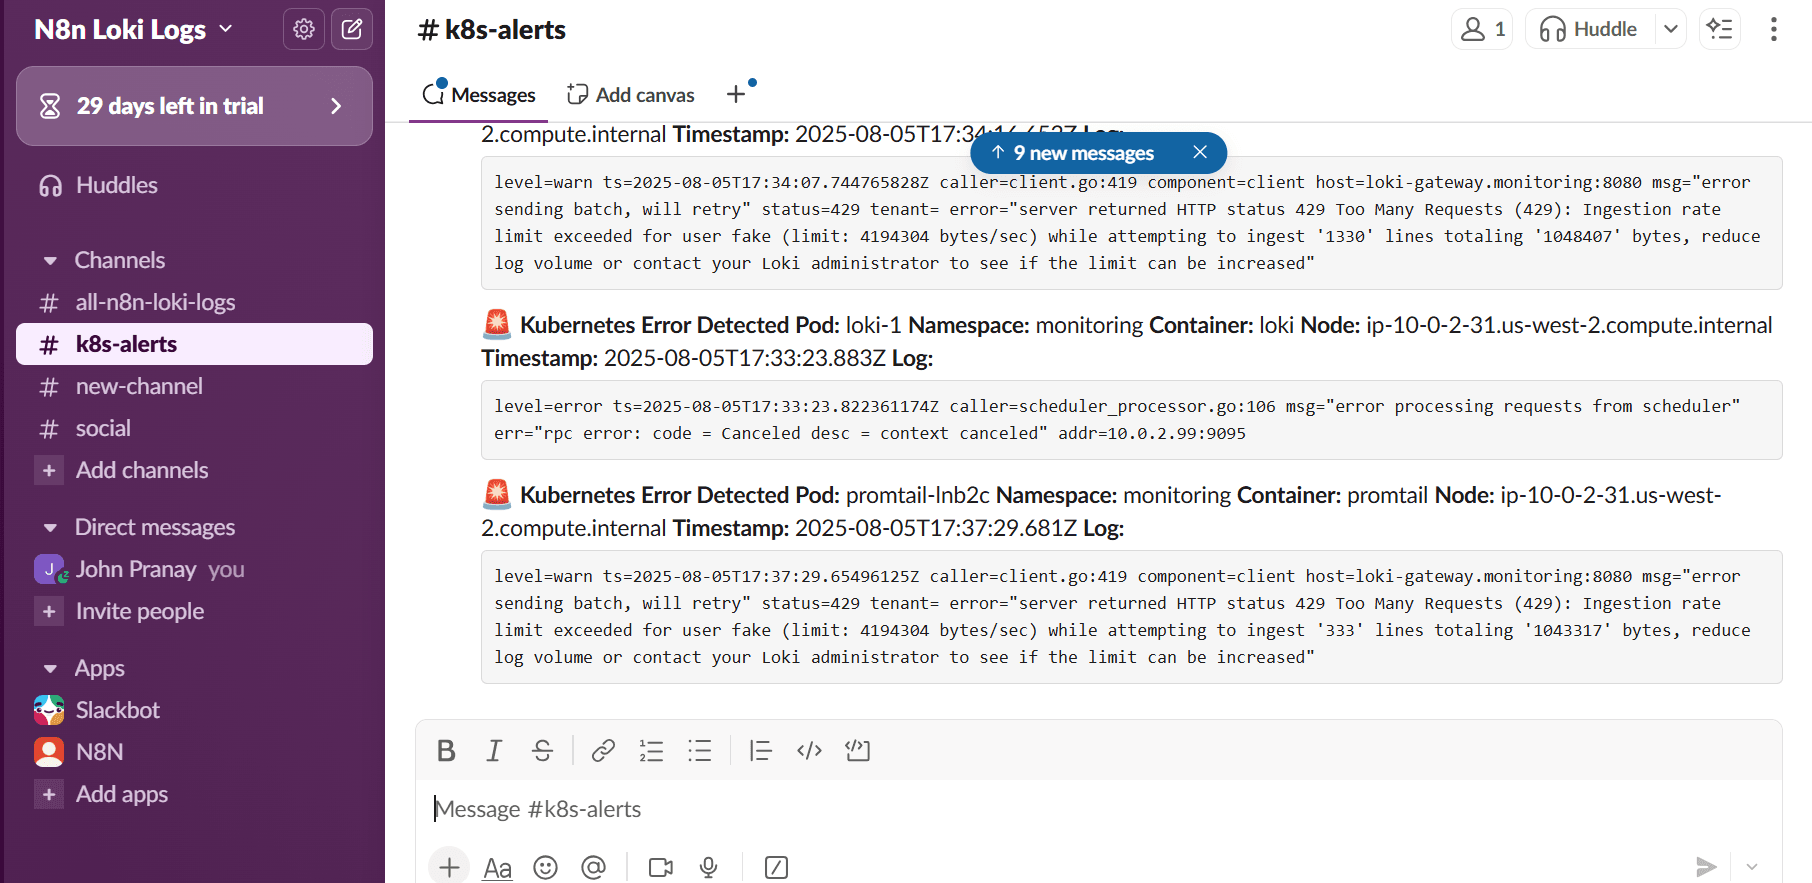
📤 Slack Notification
Sends nicely formatted message to Slack
⚙️ Requirements
Tool Notes
Loki- Exposed internally or externally
Slack App- With chat:write OAuth
n8n- Cloud or self-hosted
🔧 How to Set It Up
Import the JSON file into n8n
Update:
- Loki API URL (e.g., http://loki-gateway.monitoring.svc.cluster.local)
- Slack Bearer Token (via credentials)
- Target Slack channel (e.g., #k8s-alerts)
- (Optional) Change keywords in the query regex
- Activate the workflow
- Ensure n8n pod/container is having access to your kubernetes cluster/pods/namespaces
🛠 How to Customize
- Want more or fewer keywords? Adjust the regex in the Query Loki for Error Logs node.
- Need to increase deduplication logic? Enhance the Remove Duplicate Alerts node.
- Want 5-log summaries every 5 min? Fork this and add a Batch + Slack group sender.
Grafana Loki logs to Slack Output