This workflow demonstrates how to dynamically generate a line chart using the QuickChart node based on data provided in a JSON object and then upload the resulting chart image to Google Drive.
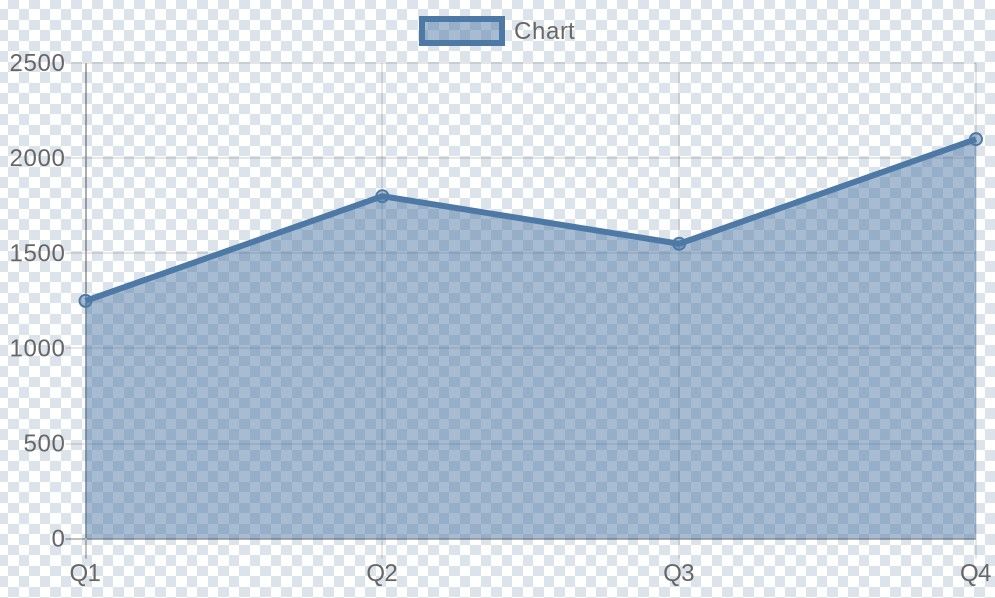
Edit Fields: Set JSON data to test) defines a sample JSON object named jsonData. This object contains:
reportTitle: A title (not used in the chart generation in this example, but useful for context).labels: An array of strings representing the labels for the chart's X-axis (e.g., ["Q1", "Q2", "Q3", "Q4"]).salesData: An array of numbers representing the data points for the chart's Y-axis (e.g., [1250, 1800, 1550, 2100]).line chart.jsonData.labels array (Labels Mode: From Array).jsonData.salesData array as the input data (Note: This configuration places data in the top-level 'Data' field. For more complex charts with multiple datasets or specific dataset options, configure datasets under 'Dataset Options' instead).data.Google Drive: Upload File):
data) from the QuickChart node.chart.png).Google Drive: Upload File node.Google Drive: Upload File node, you can change the Drive ID and Folder ID to specify exactly where the chart should be uploaded.labels and salesData arrays within the Edit Fields: Set JSON data to test node to use your own data. Ensure the number of labels matches the number of data points.Edit Fields: Set JSON data to test node with nodes that fetch data from real sources like:
labels and salesData arrays). You might need another Set node to structure the data correctly before the QuickChart node.Chart Type parameter (e.g., change from line to bar, pie, doughnut, etc.).Chart Options parameter within the QuickChart node to add titles, change colors, modify axes, etc., using QuickChart's standard JSON configuration options.Data field.Dataset Options -> Add option -> Add dataset.Data field within the dataset using an expression like {{ $json.jsonData.salesData }}.Google Drive: Upload File node with other nodes to handle the chart image differently:
Write Binary File: Save the chart to the local filesystem where n8n is running.Slack / Discord / Telegram: Send the chart to messaging platforms.Move Binary Data: Convert the image to Base64 to embed in HTML or return via webhook response.Tags: (Suggestions for tags field)
QuickChart, Chart, Visualization, Line Chart, Google Drive, Reporting, Automation